Image Data Input
Why is it beneficial to encode market data as an image rather than in the more standard time-series numerical format? The first reason is that the leading CNN architectures are custom crafted for image analysis. Therefore, to enjoy the CNN’s benefits of automated signal generation, it is useful to represent price data in the format naturally ingested by the CNN, that is, as an image. Second, representing time-series as an image allows the model to focus on relational attributes of the data that would be difficult to tease out with time-series methods. This is the same basic rationale for why humans illustrate patterns graphically rather than with lists of numbers. If a human can more readily detect patterns in images by consuming an entire data matrix through a single visualization, a statistical pattern recognition algorithm may benefit from doing so as well. Third, the process of imaging price and volume data converts all assets’ data histories into a comparable scale. We show that this particular rescaling choice has large benefits for prediction in the panel of stocks. Fourth, technical trading hinges on the presence of geometric shapes visually defined and observed by human cognition. Technical traders have long used price charts as an information source to predict returns and make investment decisions.
—Jiang J, Kelly B, Xiu D. (Re-)Imag(in)ing Price Trends[J]. The Journal of Finance, 2023, 78(6): 3193-3249.
Getting Started with Image Data
To begin using image data, we employ the mplfinance library.
For installation instructions, refer to Installation.
We’ve made minor modifications to FinOL,
enabling the transformation of raw data into images and allowing users to resize these images based on configurations
specified in a configuration file.
The following figures provide examples of stock charts generated by FinOL at different window sizes (10, 30, 60):
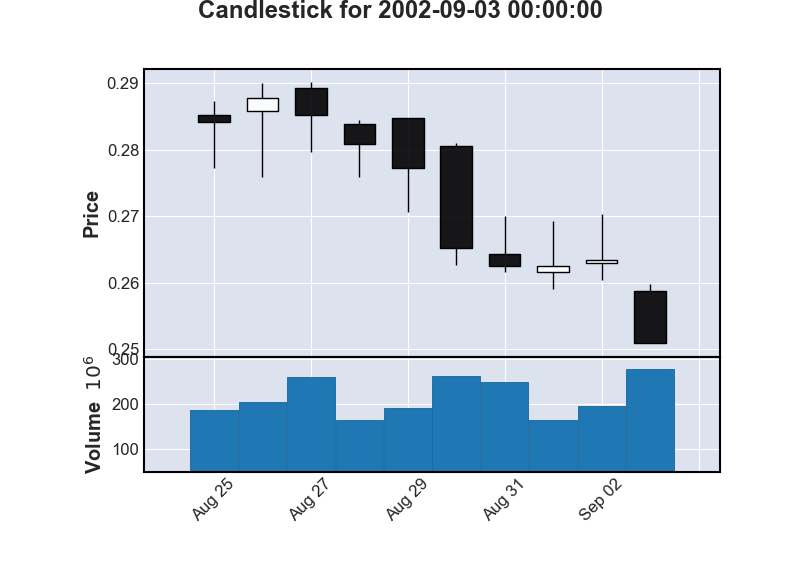
10-day Candlestick Chart
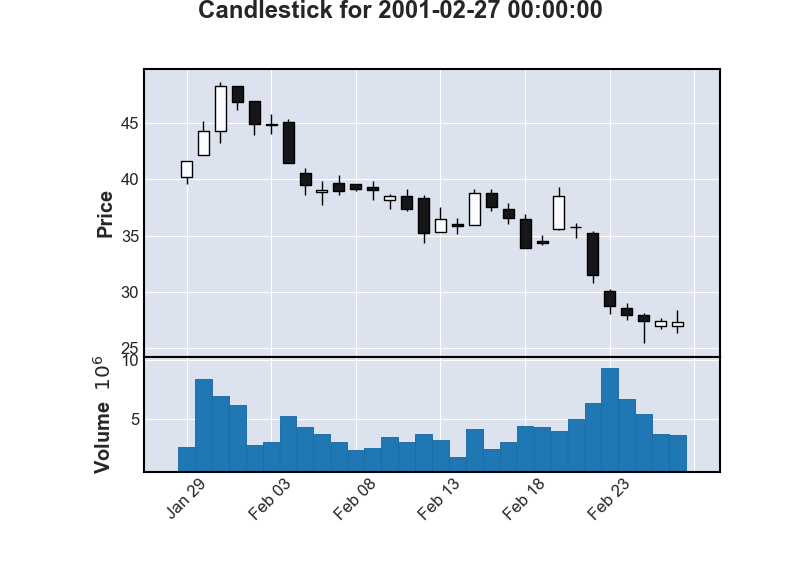
30-day Candlestick Chart
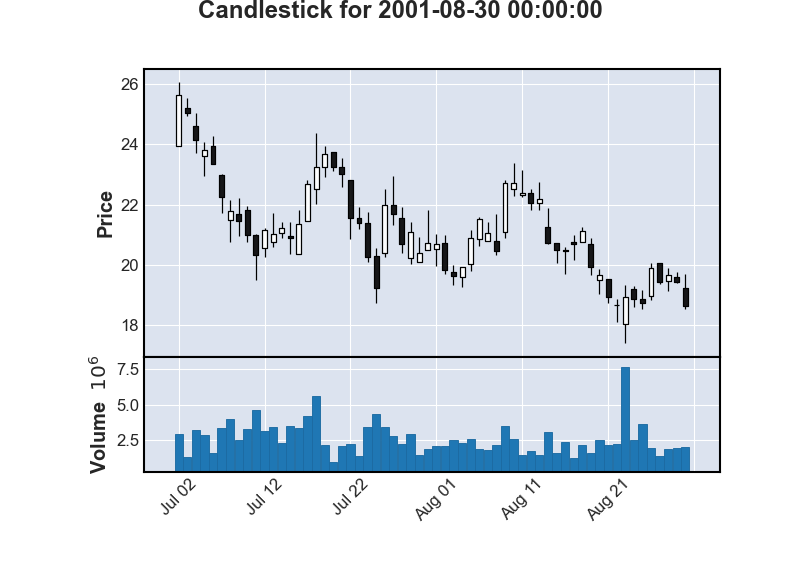
60-day Candlestick Chart
Again, we are committed to ensuring that the process of using FinOL is as easy as possible.
To get started, users simply need to configure their config.json file as follows:
"DATA_AUGMENTATION_CONFIG": {
    // ...
    "IMAGE_DATA": {
        "INCLUDE_IMAGE_DATA": true,
        "SIDE_LENGTH": 224
    }
}
By selecting a model such as CNN, CNN-JF, or a custom image-processing model in the config.json:
"MODEL_NAME": "CNN"
Users can then execute the complete FinOL pipeline with ease.
This approach not only streamlines the process of incorporating image data into data-driven OLPS
but also opens up new avenues for predictive modeling and pattern recognition in this field.
By leveraging the power of CNNs and the intuitive nature of image data,
FinOL empowers users to uncover insights that may not be apparent through conventional numerical analysis.
The Development is Ongoing
We want to note that development of FinOL’s image processing capabilities is ongoing,
with future plans to explore and develop features including but not limited to:
Data augmentation techniques for time series images such as cropping, flipping, resizing to enhance model generalizability;
Explainability tools based on image recognition to help users understand the rationale behind model decisions.
Integration of more advanced deep learning models to improve the accuracy and efficiency of image processing.
Development of a user-friendly interface to make the configuration and execution process more intuitive.
See also
See Image Representation Models for more details.